The Basics
Data Science
Data Science is a multidisciplinary field that combines statistics, computer science and business intelligence to extract meaningful information from data.


Machine Learning
Machine Learning is a method of building computer systems through finding and applying patterns learned from previous observations.
Models
In the context of machine learning, models are mathematical expressions that use a set of parameters (determined through the training process) to generate inference for new observations.
Features/covariates/explanatory variables/predictors/independent variables
These are all different ways of referring to the variables passed to a model to receive an inference result.
Target Variable/dependent variable/response variable
These are all the different ways of referring to the model output.
Hyperparameters
Parameters whose values are set ahead of the training process. They are distinguished from the other parameters in that they are unaffected by the training data (see below). Example: learning rate.
Training Set/Training Data
Data used to develop the model (i.e. determine the model parameters).
Validation Set/Validation Data
Data that is withheld from the model training process, but used to provide an unbiased evaluation of the model for the purpose of hyperparameter tuning.
Testing Set/Testing Data
Data that is withheld from the training and validation process to provide a realistic evaluation of model performance on subsequent observations.
General Concepts
Model Deployment
Model deployment is the process of integrating a Machine Learning model with a production environment, usually to make inference available to other business systems.
Feature Engineering
The series of transformation steps applied to the raw input variables prior to the training phase.
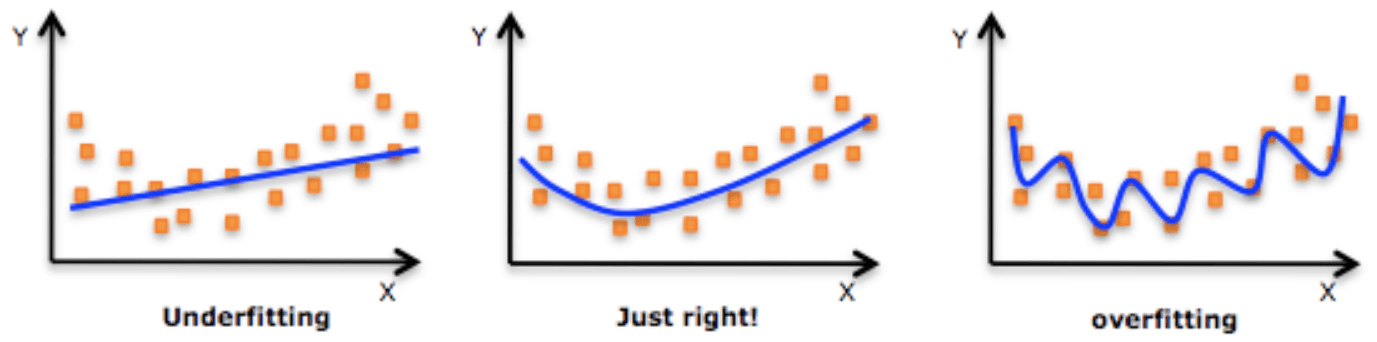
Overfitting
Overfitting is used to describe models that “fit too well” to the training data. These models are bad because they do not generalize very well.
Underfitting
Underfitting is used to describe models that learned too little from the data set, which results in a simplistic understanding of the underlying relationships.

Supervised Learning
When we have a clearly defined input and output, we can use a supervised learning algorithm (think linear regression, support vector machines) to map the input to the output based on prior observations.
Unsupervised Learning
When we have a clearly defined input, but not a clearly defined output, we need to rely on unsupervised learning algorithms (such as clustering) to draw inference from our dataset.
Semi-supervised Learning
In semi-supervised learning, we have labels for some of our observations. The classic semi-supervised learning approach is to train a model on the labelled data, use this model to infer the remaining missing labels, convert confident predictions to definite labels, retrain the model over the new labels and repeat until all data is labelled.
Regression
Regression models explain/predict the relationship between independent variables and a continuous dependent variable. Modeling house prices would be a regression problem.
Classification
Classification models explain/predict the relationship between independent variables and a categorical dependent variable. Classifying animals from pictures is a classification problem.
Clustering
Clustering is a set of unsupervised learning techniques used to group data points based on similarities within each group and dissimilarities between groups.
Natural Language Processing (NLP)
NLP is the area of machine learning tasks focused on human languages. This includes both the written and spoken language.
Computer Vision
Computer vision is the area of machine learning tasks focused on image recognition.
Feature Space
The n-dimensional space constructed by the model features.
Algorithms
a process or set of rules to be followed in calculations or other problem-solving operations, especially by a computer.- Oxford Dictionary definition
Neural Network
Neural Networks (sometimes also referred to as Artificial Neural Networks) are a class of machine learning models meant to resemble the 🧠.
Recurrent Neural Network/RNN: RNNs are a subclass of neural networks typically used to process sequential data.
Convolutional Neural Network/CNN: CNNs are a subclass of neural networks typically used to process spatial data such as images.
Deep Learning
Deep Learning is the area of machine learning that uses multi-layer neural networks.
Linear Regression
Linear Regression is used to model a linear relationship between a continuous, scalar response variable and at least one explanatory variable. Linear Regression can be used for predicting monetary valuations amongst other use cases.


Logistic Regression
Logistic Regression is used to model a probabilistic relationship between a binary response variable and at least one explanatory variable. The output of the Logistic Regression model is the log odds, which can be transformed to obtain the probability. Logistic Regression can be used to predict the likelihood of churn amongst other use cases.


Support Vector Machine (SVM)
Support Vector Machine is a binary classifier used to find the optimal hyperplane to separate the two classes in the feature space. New observations are classified based on which side of the hyperplane they fall under.
Decision Tree
A decision tree separates the feature space into distinct subsets. New observations are classified based on the subset they fall under.


Ensemble Modeling
Ensemble Modeling is the process of aggregating multiple models to make a single prediction. The key behind successful ensembling is to pick diverse models that uses very different algorithms. There are several ways of choosing the prediction using multiple models, the simplest being:
- take the most commonly predicted value
- average/weigh the scores from each model and predict the outcome from the aggregated score
Tools for Model Development
GitHub
GitHub is a web platform used for software development. It offers version control and other collaborative features such as task management and code reviews.
Docker
Dockers are used to deploy applications, including machine learning models.
Python Libraries
Without a doubt, Python is the most popular programming language for Data Scientists.
NumPy
NumPy is a numerical computation library used to structure and manipulate data. It is a building block for many other open source Data Science libraries.pandas
pandas makes it easy to read, export and work with relational data. The core pandas data structure (dataframes) organizes data into a table format that makes it easy to perform indexing, filtering, aggregating and grouping operations.Scikit-Learn/sklearn
sklearn is a comprehensive library used for data analysis, feature engineering and for developing machine learning models.TensorFlow
TensorFlow is a machine learning framework developed by the Google Brain team. The primary use of TensorFlow is for developing and productionizing deep learning models.
Keras
Keras is a deep learning library written in Python. It is a high level API that can be used on top of several deep learning frameworks, including TensorFlow.PyTorch
PyTorch is a machine learning library developed by the Facebook Artificial Intelligence Research group. It is also primarily used for developing deep learning models.
Metrics
These are some commonly used metrics for assessing model performance. When communicating model performance, we need to specify which dataset we obtained these metrics from in addition to the metrics themselves. A training accuracy of 95% is not the same as a testing accuracy of 95%!
Metrics for Binary Classification
We are usually more interested in the presence of one class than the other. For example, we are more concerned if a client is “fraudulent” than if they are not fraudulent. Let’s persist this example when defining the following terms.
False Positive/Type 1 Error (FP): this is an observation we misclassified as being our class of interest (example: a non-fraudulent client misclassified as fraudulent).
False Negative/Type 2 Error (FN): this is an observation we misclassified as not being our class of interest (example: a fraudulent client misclassified as non-fraudulent).
True Positive (TP): this is a fraudulent client that we correctly classified
True Negative (TN): this is a non-fraudulent client that we correctly classified
Precision: precision is calculated as
TP/(TP+FP) where TP is the number of true positives and FP is the number of false positives
Recall: recall is calculated as
TP/(TP + FN) where TP is the number of true positives and FN is the number of false negatives
F1-Score: as we can see above, optimizing for precision means reducing the number of false positives while optimizing for recall means reducing the number of false negatives. We use F1-score to combine these metrics. F1-score is calculated as
2 * (precision * recall) / (precision + recall)
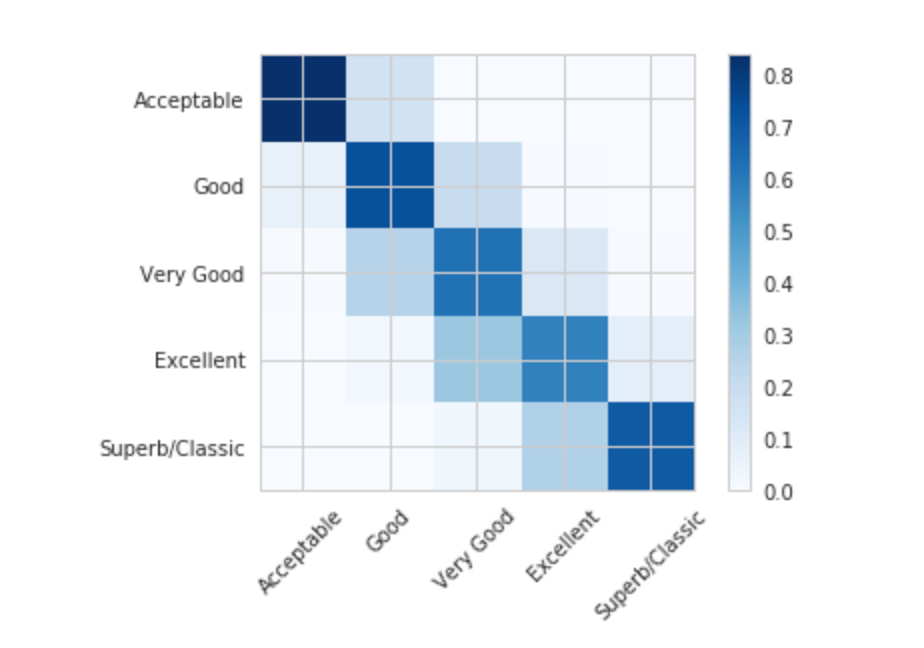
Confusion Matrix: the confusion matrix is a visual representation of TP, FP, FN, TN.


Metrics for Multi-class Classification
Most metrics used for binary classification can be used to assess the performance of each class in the multi-class scenario. If we had 3 classes, we would derive 3 precision scores. For each precision score, the TP would be the number of correct predictions we made for that class and FP would be the number of times we misclassified one of the other 2 classes as that class.
The confusion matrix can also be generalized as an n x n matrix where n is the number of classes. The cell with row i and column j represents the number of class i predicted to be class j.

Accuracy: the % of correct predictions. This is a good representation of model performance when class sizes are fairly balanced.
Metrics for Regression
Mean Squared Error (MSE): Mean Squared Error averages the square of the difference between the actual and predicted values. This is one of the most common metrics used to evaluate regression models.
Root Mean Squared Error (RMSE): RMSE is the square root of MSE. MSE is usually selected in favor of RMSE because it is easier to work with (one less operation).
Mean Absolute Error (MAE): MAE is the average of the absolute difference between the actual and predicted values.
R-squared/Coefficient of Determination: R-squared is a statistical measure of the % of variance found in the data that can be “explained” by the model.
Adjusted R-squared: Adjusted R-squared adjusts R-squared by penalizing the number of parameters.

